


Published in 2020, this is an older edition of IJ’s landmark Policing for Profit report. You can download the report here, but please see the fourth and current edition for the most up-to-date information.
Additional Resources
New Mexico Crime Analysis
National Data
National_Revenue.csv contains standardized key forfeiture revenue data for 45 states. Click for key variables, definitions and values.
National_Expense.csv contains standardized key forfeiture expenditure data for 16 states. Click for key variables, definitions and values.
State Data
State_Revenue.zip contains separate forfeiture revenue datasets for each state. Each spreadsheet includes the standardized key variables contained in Revenue.csv and additional variables unique to each state. See the data notes on state profiles for details about a particular state. Contact the authors for documentation pertaining to individual states. Click for key variables, definitions and values.
State_Expense.zip contains separate forfeiture expenditure datasets for each state. Each spreadsheet includes the standardized key variables contained in Expense.csv and additional variables unique to each state. See the data notes on state profiles for details about a particular state. Contact the authors for documentation pertaining to individual states. Click for key variables, definitions and values.
Federal Data
Variables, Definitions and Values
National Revenue Data
- RevenueID – Unique ID for row in Revenue.csv. Also serves as the primary key in IJ’s database.
- ID – Foreign key for IJ’s database maintenance purposes.
- YEAR – Generally represents the fiscal or calendar year in which property was forfeited. If date was not available, YEAR represents the year for which the report was filed.
- UNIT_TYPE – Unit of observation. Values: property, case, other. “Other” units include data reported at higher levels, such as by agency, county, or state, among others.
- PROP_TYPE – Type of property forfeited. Values: currency, vehicles, real property, other.
- REV – Value forfeited. Value can include estimated value, gross revenue or net proceeds; varies by state.
- PROCD_TYPE – Type of forfeiture proceeding. Values: civil judicial, civil, criminal, administrative, judicial, summary, contested, uncontested, other, unknown.
- CONV_TYPE – Conviction outcome. Values: conviction, no conviction.
- CASE_NO – Case number associated with the forfeiture.
National Expenditure Data
- RevenueID – Unique ID for row in Expense.csv. Also serves as the primary key in IJ’s database.
- ID – Foreign key for IJ’s database maintenance purposes.
- YEAR – Generally represents the fiscal or calendar year in which funds were spent. If date was not available, YEAR represents the year for which the report was filed.
- EXP_TYPE – Category of expense paid from forfeiture fund. Values: court costs, community programs and donations, outside services, travel and training, investigation costs, victim compensation and services, operating expenses, personnel, equipment and capital expenditures, other.
- EXP_AMT – Amount expended.
State Revenue Data
- RevenueID – Unique ID for row in Revenue.csv. Also serves as the primary key in IJ’s database.
- ID – Foreign key for IJ’s database maintenance purposes.
- YEAR – Generally represents the fiscal or calendar year in which property was forfeited. If date was not available, YEAR represents the year for which the report was filed.
- UNIT_TYPE – Unit of observation. Values: property, case, other. “Other” units include data reported at higher levels, such as by agency, county, or state, among others.
- PROP_TYPE – Type of property forfeited. Values: currency, vehicles, real property, other.
- REV – Value forfeited. Value can include estimated value, gross revenue or net proceeds; varies by state.
- PROCD_TYPE – Type of forfeiture proceeding. Values: civil judicial, civil, criminal, administrative, judicial, summary, contested, uncontested, other, unknown.
- CONV_TYPE – Conviction outcome. Values: conviction, no conviction.
- CASE_NO – Case number associated with the forfeiture.
Note: Arkansas’ data departs from the file name convention because it had only seizure data and no consistent forfeiture revenue data.
State Expenditure Data
- RevenueID – Unique ID for row in Expense.csv. Also serves as the primary key in IJ’s database.
- ID – Foreign key for IJ’s database maintenance purposes.
- YEAR – Generally represents the fiscal or calendar year in which funds were spent. If date was not available, YEAR represents the year for which the report was filed.
- EXP_TYPE – Category of expense paid from forfeiture fund. Values: court costs, community programs and donations, outside services, travel and training, investigation costs, victim compensation and services, operating expenses, personnel, equipment and capital expenditures, other.
- EXP_AMT – Amount expended.
Press Release
Check out this report's press release and contact our media team member for additional information.
Press Release
New Report Finds Civil Forfeiture Rakes in Billions Each Year, Does Not Fight Crime
ARLINGTON, Va.—Nationwide, civil forfeiture laws put innocent property owners at risk and encourage law enforcement to police for profit, with billions of dollars forfeited each year. So finds the latest edition of “Policing for Profit: The […]
Related Reports

Civil Forfeiture | Private Property
Bad Data
Every year, Indiana prosecutors produce reports for lawmakers detailing forfeiture activity in the state, but Bad Data shows these reports should be taken with a multimillion-dollar grain of salt.

Civil Forfeiture | Private Property
Frustrating, Corrupt, Unfair
Victims of civil forfeiture call it frustrating, corrupt and unfair. This first-of-its-kind survey describes the experiences of victims of one civil forfeiture program, Philadelphia’s.
Civil Forfeiture | Private Property
Does Forfeiture Work?
Forfeiture is a controversial tool police and prosecutors use to take and keep people’s cash, cars and even homes under the guise of fighting crime. This study is the first to look at whether state…
Civil Forfeiture | Private Property
Fighting Crime or Raising Revenue?
Forfeiture is a controversial tool governments use to take and keep property often without charging or convicting anyone with a crime. Police typically get a portion of the proceeds. Proponents argue forfeiture helps police…

Civil Forfeiture | Private Property
Forfeiture Transparency & Accountability
Every year, local, state and federal law enforcement agencies across the United States seize and keep billions of dollars in cash, cars, homes and other property using a legal tool called forfeiture. Criminal forfeiture requires…

Civil Forfeiture | Private Property
Policing for Profit: Second Edition
Policing for Profit, 2nd Edition Published in 2015, this is an older edition of IJ’s landmark Policing for Profit report. You can download the report here, but please see the fourth and current edition for the most…

Civil Forfeiture | Private Property
Policing for Profit: First Edition
Policing for Profit, 1st Edition Published in 2010, this is an older edition of IJ’s landmark Policing for Profit report. You can download the report here, but please see the fourth and current edition for the most…
Civil Forfeiture | Private Property
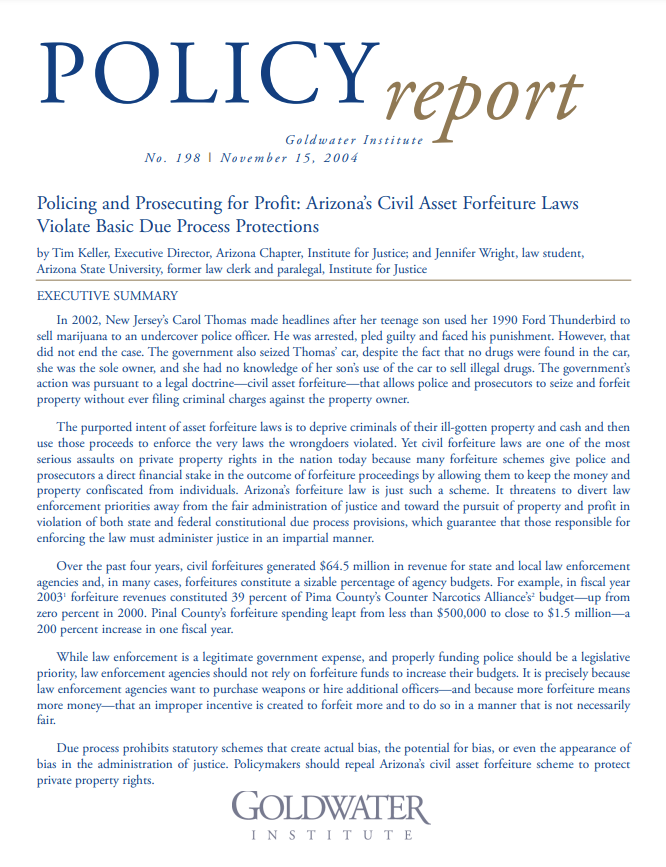
Policing and Prosecuting for Profit
In 2002, New Jersey’s Carol Thomas made headlines after her teenage son used her 1990 Ford Thunderbird to sell marijuana to an undercover police officer. He was arrested, pled guilty and faced his punishment. However,…