


In the 2024 case Culley v. Marshall, the Supreme Court reaffirmed that the Constitution guarantees a timely hearing in court when a person’s property is seized for civil forfeiture. Unfortunately, as this fourth edition of Policing for Profit finds, civil forfeiture procedures frequently fail to deliver on this promise, and this lack of due process compounds long-standing problems documented in earlier editions.
Like prior editions, this report grades all state and federal forfeiture laws. It finds most still do poorly because they allow police and prosecutors to take and permanently keep property without ever proving the owner committed a crime—and then spend some or all the proceeds themselves. It gathers data describing the scope of civil forfeiture and finds it remains extensive: Since 2000, forfeiture has generated at least $82 billion nationwide. And it examines the controversial federal equitable sharing program, including new analyses of how of often “shares” of property are granted and the effects of recent reforms.
For the first time, this edition also looks at what must happen for a property owner to get the day in court the Constitution says they are owed.
Available data show most civil forfeiture cases end in default. There is no real hearing before a judge, no arguments from both sides, and no neutral examination of the forfeiture’s legal justification before an owner loses property forever. This is because getting to court is rife with procedural hurdles, like confusing notices, tight deadlines, and complex filing requirements, as well as significant costs. A single mistake virtually ensures forfeiture by default. In this way, civil forfeiture effectively sidelines the judiciary, heightening the risk that owners may be wrongfully deprived of their property.
The few owners who do reach a courtroom often go months or longer without their property. By statute alone, reaching a hearing can take months, and in practice, civil forfeiture cases often take far longer. Losing access to cash or a vehicle for that long can threaten livelihoods and create intense pressure to settle, even if owners did nothing wrong.
Courts are increasingly coming to recognize the serious due process problems posed by civil forfeiture—and even holding the government to account for them. This trend should continue. But civil forfeiture requires root and branch reform: The best way to protect property and due process rights is to end civil forfeiture and the perverse financial incentive that fuels it.
Key Findings

$2–3 billion
Since 2014, the federal government has forfeited $2 billion to $3 billion per year, while 34 states have forfeited $300 million to $350 million.

71%
Most seizures end in administrative or default forfeiture—not a hearing. Among DOJ forfeitures, 71% were forfeited administratively. In three states with data, 62% to 76% of seizures were forfeited by default.
$1,678
Across 24 states, half of currency forfeitures are worth less than $1,678. The estimated cost to hire an attorney is nearly twice that, $3,300.

6 months
For the few owners who reach a judge, it will likely take months. In half the states, the known deadlines leading up to a hearing add up to 188 days—more than six months.
Press Release
Check out this report's press release and contact our media team member for additional information.
In The News
Related Reports

Civil Forfeiture | Private Property
Bad Data
Every year, Indiana prosecutors produce reports for lawmakers detailing forfeiture activity in the state, but Bad Data shows these reports should be taken with a multimillion-dollar grain of salt.
Civil Forfeiture | Private Property
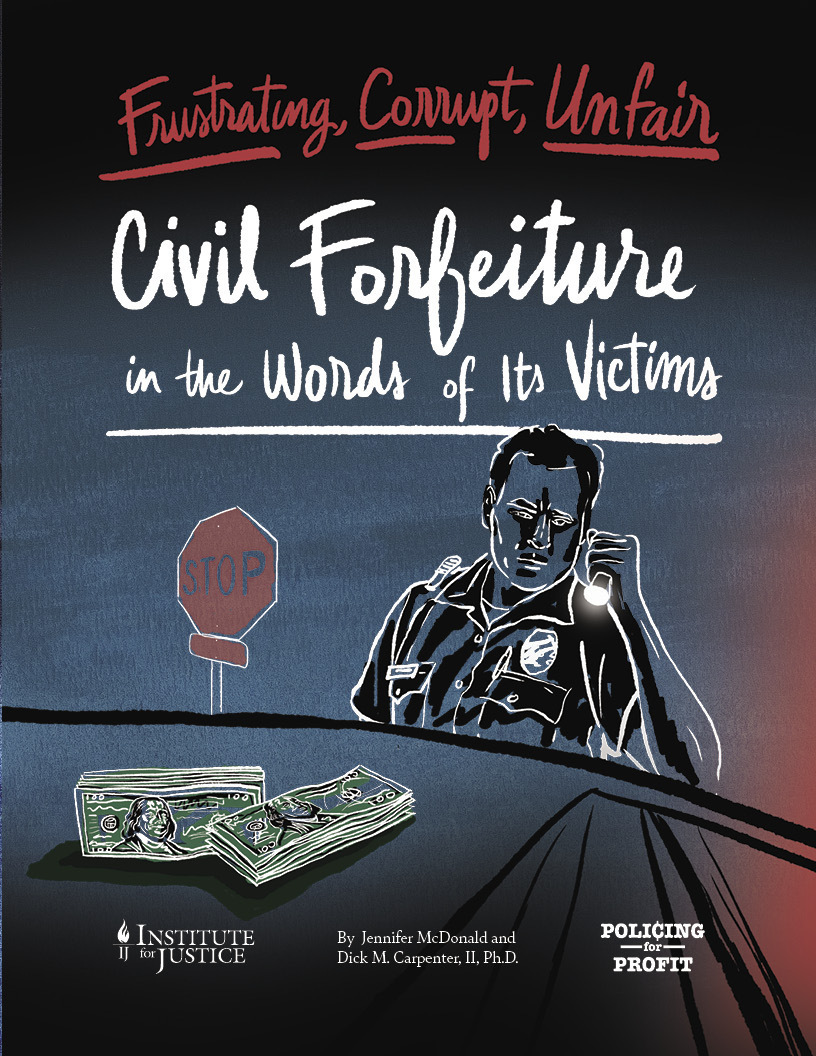
Frustrating, Corrupt, Unfair
Victims of civil forfeiture call it frustrating, corrupt and unfair. This first-of-its-kind survey describes the experiences of victims of one civil forfeiture program, Philadelphia’s.

Civil Forfeiture | Private Property
Forfeiture Transparency & Accountability
Every year, local, state and federal law enforcement agencies across the United States seize and keep billions of dollars in cash, cars, homes and other property using a legal tool called forfeiture. Criminal forfeiture requires…
Civil Forfeiture | Private Property
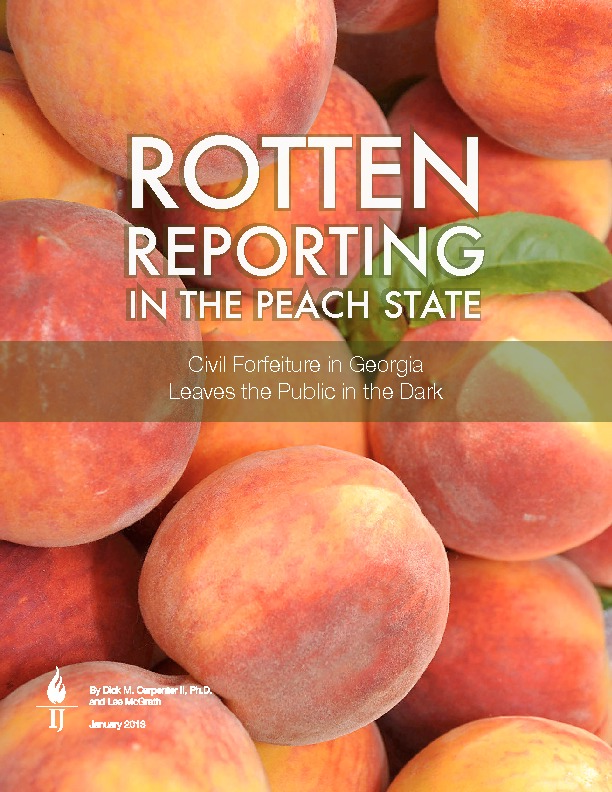
Rotten Reporting in the Peach State
Georgia has some of the worst civil forfeiture laws in the nation, a problem compounded by law enforcement agencies’ routine failure to report forfeiture revenue and expenditures as required by law. But a 2011 Institute…
Civil Forfeiture | Private Property
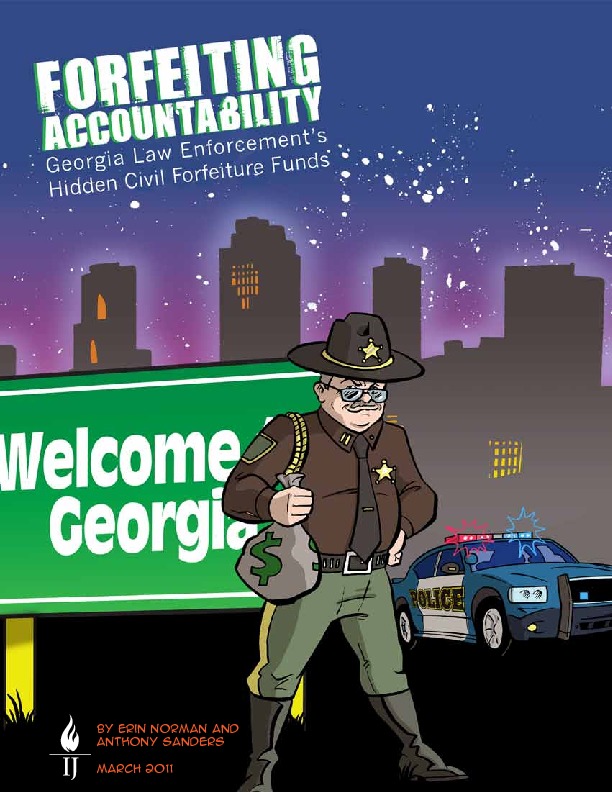
Forfeiting Accountability
Georgia has some of the worst civil forfeiture laws in the country. But at least state law requires law enforcement to publicly report annual forfeiture proceeds and expenditures. Public reporting ought to help check abuse…